The price of Litecoin seemed to be going downhill after its halving with few attempts at recovery. Additionally, towards the end of September, the market slump that shook the industry pushed the price of the coin to a low of $53. The price of the coin has been stagnant in the zone and hasn’t come close to breaching $60, ever since.
At the time of writing, Litecoin’s price witnessed a positive 0.95% change over the last 24-hours while its price still stood at $57.12.
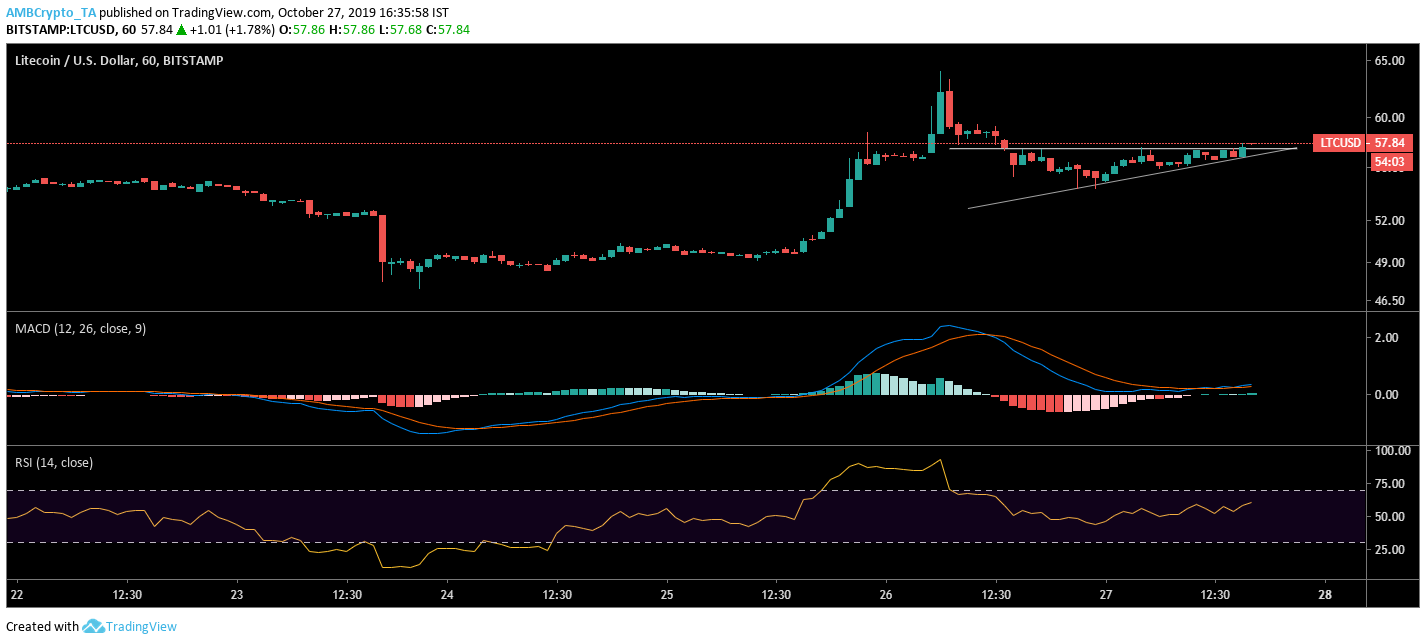
Litecoin 1-hour chart
Source – LTC/USD on Trading View
An ascending triangle pattern was formed by the digital silver on its 1-hour price chart as a series of higher lows were formed at $54.31, $54.79 and $56.74 along with a constant high at $57.40. Additionally, the low volume seen in the chart affirmed the formation of the aforementioned pattern. The ascending triangle pattern is deemed to be bullish due to the direction of its breakout, which is upwards.
The 100 moving average was seen lounging below the 50 moving average further indicating a bullish zone for Litecoin. The 50 moving average [blue] is seen below the candlesticks acting as a support for the coin.
Key Indicators
Source – LTC/USD on Trading View
As seen in the above chart, the MACD line has been below the signal line for quite some time. However, MACD line was seen slowly overtaking the signal line, further hinting at the presence of bulls in the market. Since the RSI line was recorded above the 50 median, key indicator, Relative Strength Index revealed buyers’ sentiment in the Litecoin market.
Conclusion
LTC may breach $57 and head towards $60 if the bulls continue to reign the Litecoin market as it gears up for an upward breach due to the formation of an ascending triangle pattern.


Be the first to comment