After days and days of consolidation, bitcoin finally managed to break a new high for the first time in almost two weeks. This new high, so far, has been short lived, however, as it was almost immediately sold into by eager bears:

Figure 1: BTC-USD, 4-Hour Candles, New High
Our current 4-hour candle is seeing a relatively easy retracement after days and days of an upward grind. We managed to close a new high, but it was quickly rejected and, depending on where the currently daily closes, could lead to a macro reversal setup known as a Swing Failure Pattern (SFP):

Figure 2: BTC-USD, Daily Candles, Potential SFP
An SFP is characterized simply as a push to a new high that fails to close above the previous high. This is a tactic often used by large institutions to generate liquidity prior to a market reversal. In our case, since we are dealing with daily candles, this could mean we are in for a test of new lows in the mid $3,500s. If we manage to see a reversal, the first logical level to test is the $3,700 range. If we manage to close a candle below that and our prior low, we could be in for a nasty run to the low $3,000s:
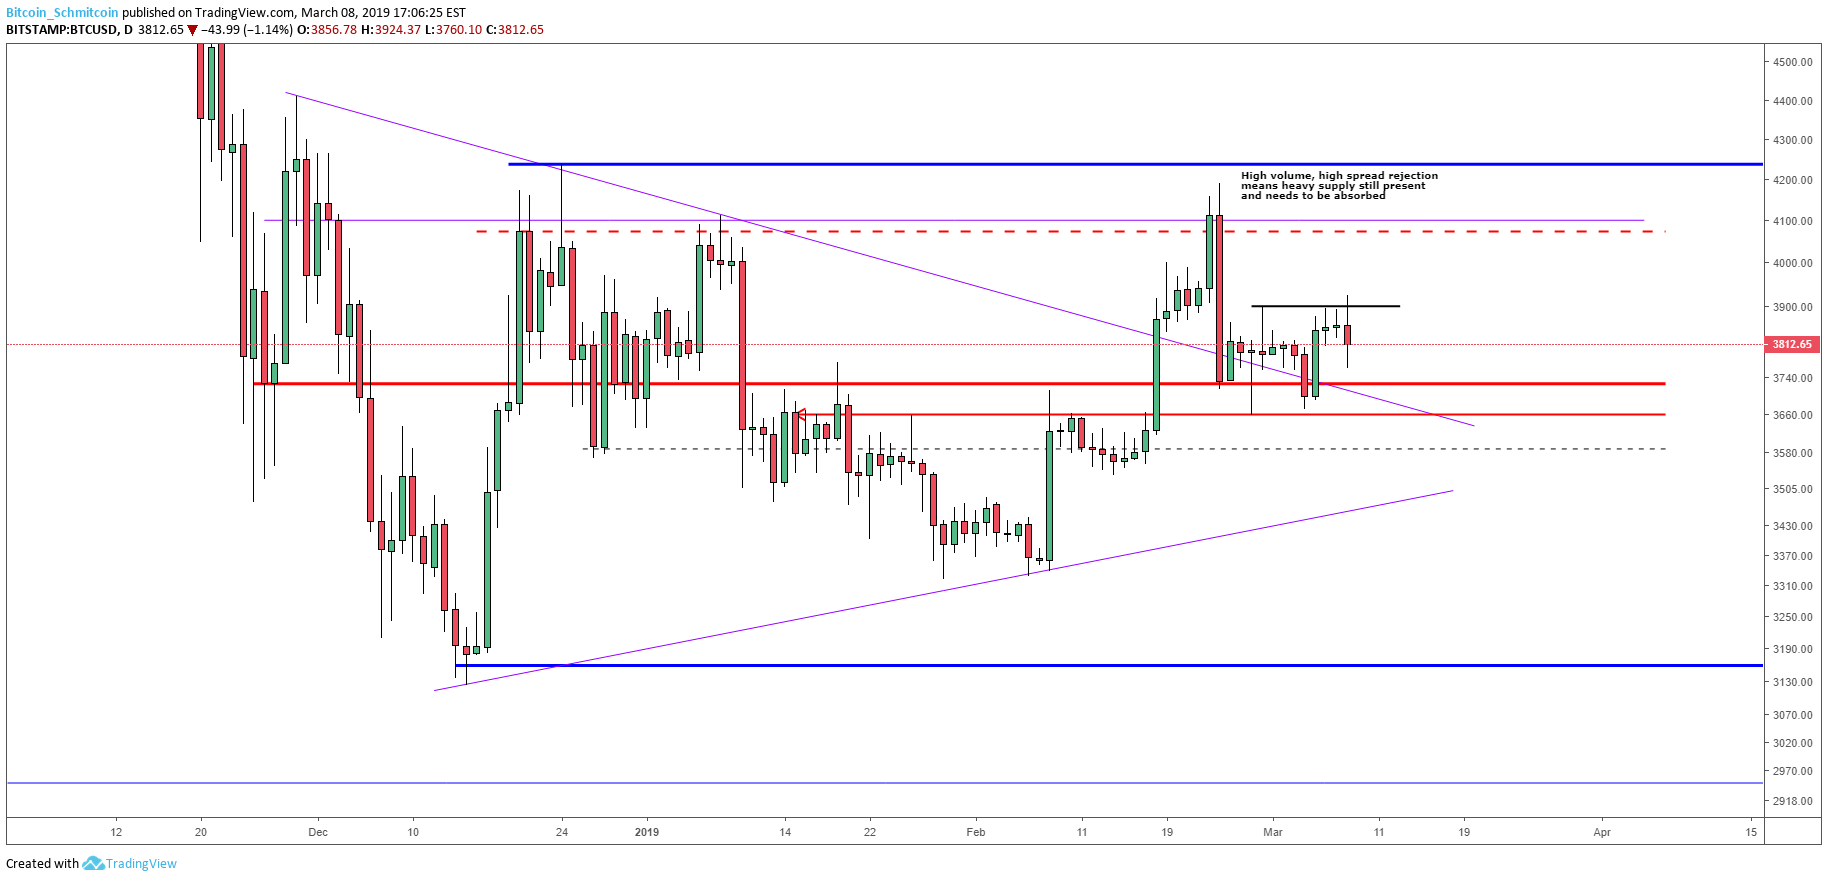
Figure 3: BTC-USD, Daily Candles, Zone of Support
The red zone outlined above has been our latest level of support over the last few weeks. It also proved to be a point of resistance in the past and represents a major pivot level in our current market structure. If we break below this level, it would represent a third failed attempt to hold support and could lead to a strong, powerful move to the downside. We never retested our macro low in the $3,000 level, so we could be in for a major move to test macro support. Three failed attempts to break out of our range (all three with very powerful rejections) show that our market is still very dominated by supply within our current range.
Right now, our test of resistance is still fresh so it’s a bit early to make a macro market call. But one thing that is clear is the presence of supply. When we look at Figure 3 we can see large daily candles rejecting our tests of the $4,000s and so far we have yet to give a very strong test of macro support. So, it seems logical that after three failed attempts the likely course of action for the macro market would be a test of $3,000.
As stated, the move is still fresh so we need to take it day by day. Keep an eye out for the level outlined in red as a close below this would likely confirm a strong continuation to the downside. We have many trapped bulls at our current level and a strong move to the downside could potentially squeeze them out of the positions.
Summary:
- Bitcoin finally broke a new high but was rejected immediately. This rejection sets us for a reversal called a “Swing Failure Pattern.” The failure to close above the new high could mean the a liquidity run took place for large institutions to short the market.
- On a macro level, the market failed to break out of our multi-month range three times — indicating supply dominance in the market.
- If we manage to see a strong continuation, we could easily see a test of the $3,000s before any meaningful upward progress is realized in the market.
Trading and investing in digital assets like bitcoin is highly speculative and comes with many risks. This analysis is for informational purposes and should not be considered investment advice. Statements and financial information on Bitcoin Magazine and BTC Inc related sites do not necessarily reflect the opinion of BTC Inc and should not be construed as an endorsement or recommendation to buy, sell or hold. Past performance is not necessarily indicative of future results.
Be the first to comment